3 SEO Reports to Include in Your Marketing Dashboard

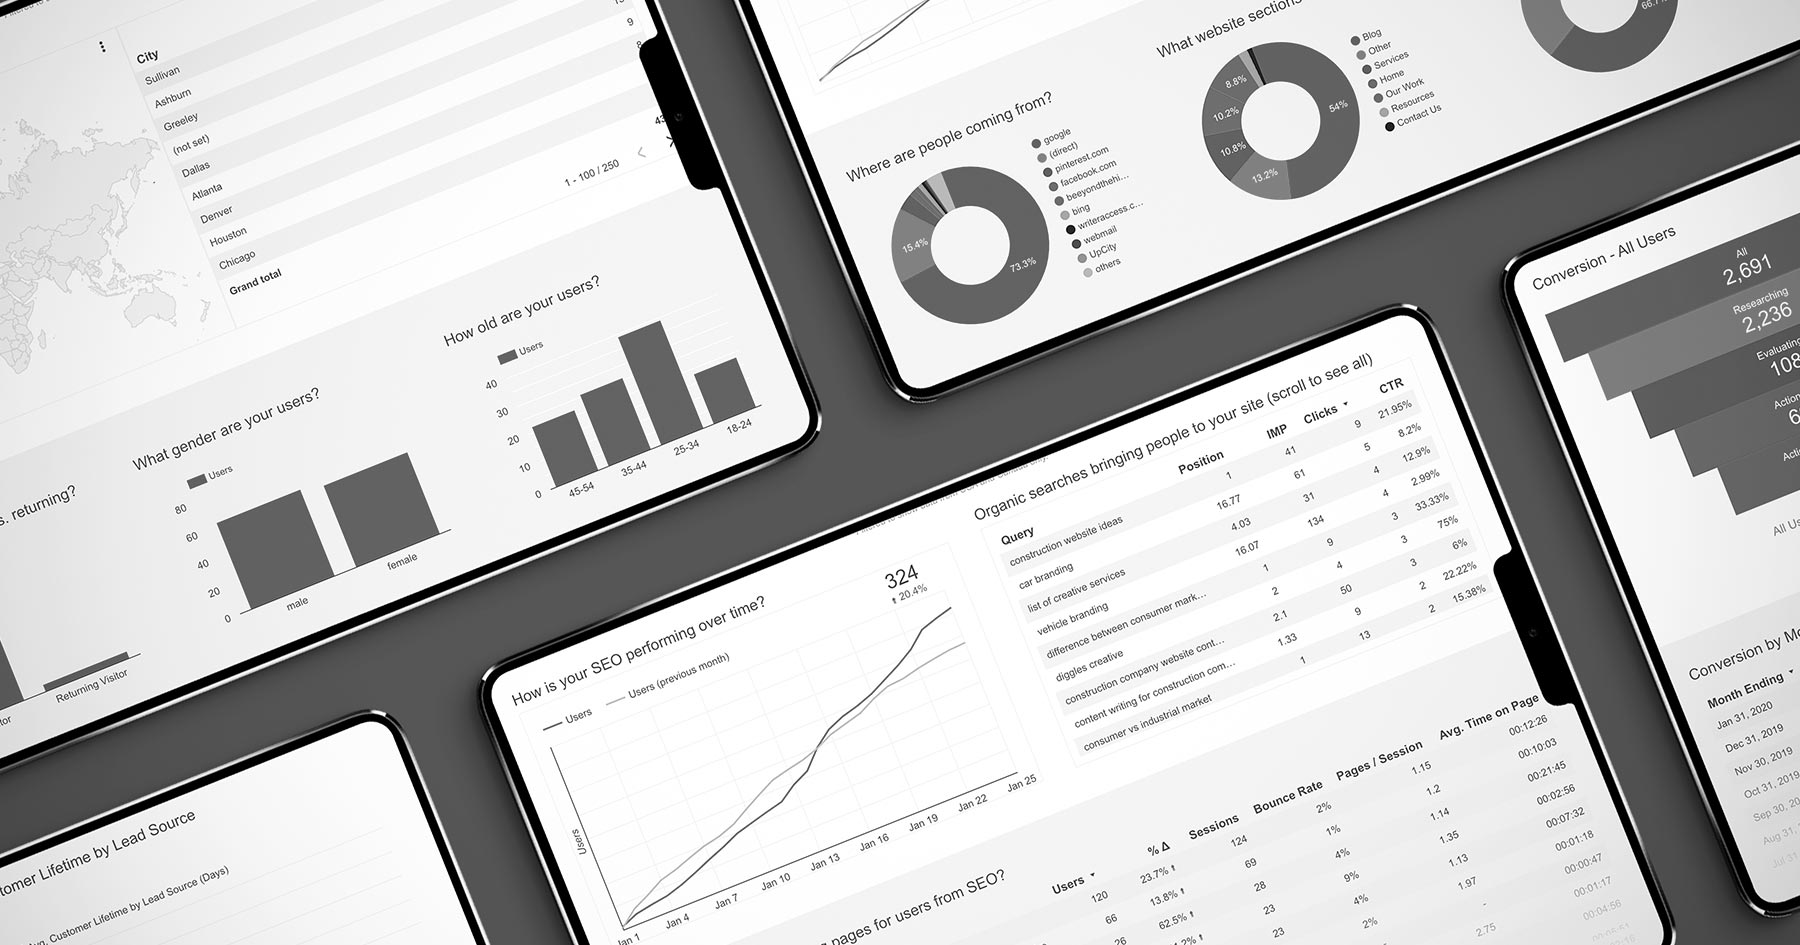
In this article we are going to look at three SEO (search engine optimization) reports that we recommend every business include in their marketing dashboard. Each example includes a screenshot and an explanation of how to read the report. We’ll also describe the insight it provides and how it can be used to improve results for your business.
Report #1: How is your SEO performing over time?

How to read this data?
Users are how many people visited your website. We like to measure users because 1 User = 1 Potential Lead.
What does this tell you?
This type of report is a great way to visualize your progress towards reaching a goal. Let’s say your goal is to increase organic website traffic 10% compared to the previous quarter. This report tells you that you are about 15% behind last quarters numbers. You've got some catching up to do!
Why is it important to track your SEO performance over time?
Including this report in your marketing dashboard helps you determine whether or not your SEO strategy is working. This report shows the progress you are making towards your goal and if you need to make any adjustments in order to meet it.
Something to think about
Is organic traffic to your website improving over time?
Report #2: What pages from organic search do your website visitors find the most interesting?

How to read this data?
Look at the number of users. The higher the number of users, the more traffic the page generates from SEO. Also look at the bounce rate, the average time on page, and the number of pages / session to see if these pages really interest users and encourage them to browse other pages on your website.
What does this tell you?
The number of users and sessions tells you that people are finding your pages in search engines and clicking through to your site.
A low bounce rate tells you that your website visitors are interested in your business because they are clicking through to other pages on your site.
A high bounce rate could mean that your page isn’t what users are looking for, so they are leaving. It could also mean that your page sufficiently answers their questions, but doesn't include any next steps, so they don't feel the need to keep looking around.
Average time on page and pages / session indicate how interesting users find your website. The longer people spend on your website and the more pages they look at means they find your site useful.
Why is it important to know what pages your website visitors find interesting?
Including this report in your marketing dashboard tells you what pages are bringing the most visitors to your website and how long they are sticking around. You will be able to use this information to pinpoint your best and worst performing pages so you have a better understanding of what people care about and how to better meet that need.
Just so you know
Your position on the first page of organic search results influences click-through rates significantly. For the #1 spot, the average CTR is 35% while the #10 spot gets 1.2%.
Source: Google Organic CTR History
Report #3: What organic searches are bringing people to your site?

How to read this data?
The query column shows phrases people are searching that lead to your site. The position column shows your website's average rank for the query. The IMP (impressions) column shows how many times your website was displayed in search results. CTR (click-through rate) is the percentage value of clicks/impressions, i.e. how many people clicked your link when they saw it in search engine results. We like to sort this report by clicks because we believe it is the most important indicator that leads to sales.
What does this tell you?
Look at the query “sustainable marketing.” This term is clicked on the most, but it could be improved. Even though it ranks on the first page, the CTR is only 1.69%. This is most likely because it is not ranked in the top three results. In comparison, the CTR for “construction company website ideas” and other related terms is 25% or higher. This leads me to believe that improving the position for the “sustainable marketing” search term will substantially increase the number of visitors to the website.
Why is it important to know what people are searching for?
Knowing what people are actually searching for when they click through to a page on your site tells you what you are doing right. You’ve hit on a topic that people care about, and you’ve done a good job of optimizing your web page. Most importantly, you know how to do it again.
Just so you know
If you are looking for ways to create top-ranking pages, answers to your customer's questions provide the best material.
How measuring your SEO will help your business succeed
When you are making a purchasing decision, odds are that you turn to the internet to research your options. You ask questions and click through to the website that you feel does the best job of answering your question. If you like what you see when you get there, then you are much more likely to do business with them. If not, then you will keep looking.
That’s really what search engine optimization is all about–helping people find answers to their questions. Including these three SEO reports in your marketing dashboard helps you understand if you are doing a good job. Are you writing about what matters to people? When people come to your website will they like what they see? Will they understand how you can help them solve their problems?
If you're not sure how to improve your marketing in a cost effective way, grab a copy of our Strategic Marketing Ebook. It'll help you get predictable results and make your company more money.
If you are interested in learning more about our approach to the items discussed in this article, call (970) 744-3611 or send us an email so we can talk about what that would look like.


